by Carole Fennelly
May 24, 2022

Identifying both the current vulnerabilities and the vulnerabilities that have been mitigated provides IT managers an accurate picture of the health of their organization's network. Tenable.sc Continuous View has the ability to track mitigated vulnerabilities, enabling management to track and measure progress. This report provides technical managers with a clear method to communicate progress to executive management.
Throughout the report there is a continued comparison of mitigated vulnerabilities to unmitigated vulnerabilities. The first chapter provides a 3-month trend of vulnerabilities and other related charts focusing on vulnerability counts per subnet. The second chapter provides a series of matrices with an in-depth look at vulnerabilities by severity, by CVSS score, by CVE identifier, and by Nessus and Nessus Network Manager (NNM) plugin groupings.
The report is available in the Tenable.sc Feed, a comprehensive collection of dashboards, reports, assurance report cards and assets. The report can be easily located in the Tenable.sc Feed under the category Executive. The report requirements are:
- Tenable.sc 5.0.1
- Nessus 8.5.1
- LCE 6.0.0
- NNM 5.9.0
Tenable provides continuous network monitoring to identify vulnerabilities, reduce risk, and ensure compliance. Tenable.sc Continuous View (CV) provides the ability to report on both current and mitigated vulnerabilities. With more supported technologies than any other vendor, including operating systems, network devices, hypervisors, databases, tablets, phones, web servers, and critical infrastructure, Tenable.sc CV scales to meet future vulnerability management demands for virtualized systems, cloud services, and the proliferation of devices.
teams.
Chapters
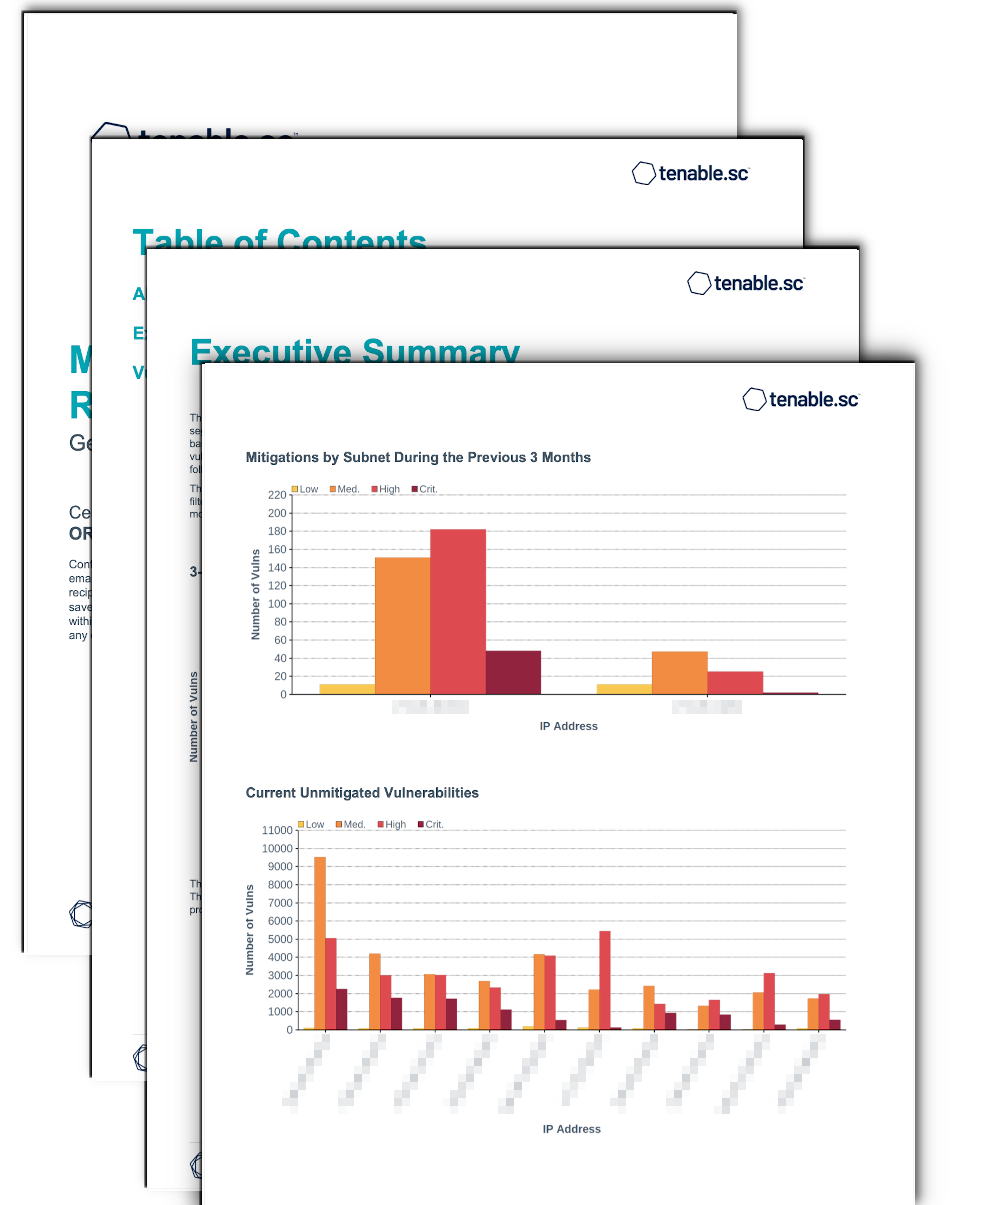
Executive Summary - This chapter provides executives with high-level understanding of vulnerability history, and which network segments are at the most risk. The first component is a 3-month trend of vulnerabilities followed by two bar charts. The bar charts provide a side-by-side comparison of vulnerability mitigation by subnet. The vulnerabilities that have been mitigated are in the top bar chart and current vulnerabilities are shown in the following chart.
Vulnerability Summaries - This chapter provides a series of matrices showing the relationship between mitigated vulnerabilities and unmitigated. The matrices are created using different criteria. The components provide an analysis using CVSS, CVE, and operating systems.